Major and trace element geochemistry of sediments is a very useful tool for understanding the provenance, intensity of weathering, tectonic settings, and depositional environment of the sediments. Sediments collected from different geomorphic domains (onshore and nearshore) of Rasulpur to Subarnarekha River mouths estuarine complex, East coast of India, were analyzed for their geochemical (major, trace contents) and mineralogical characteristics to determine their provenance, compositional maturity, paleo-weathering condition, and depositional environment. From geochemical studies, it is evident that the samples from the nearshore area suffered more weathering than the onshore samples. Geochemistry of the sediments suggests the protolith of the area to be of intermediate to felsic source rocks. A relative increase in the Al2O3/TiO2 ratio in sediments also suggests that they are derived mainly from intermediate to felsic source rocks. A strong positive correlation between Fe2O3, MnO, K2O, MgO, CaO, P2O5, and major oxides with respect to Al2O3 indicates that they are associated with micaceous/clay minerals. The Index of Compositional Variability (ICV) indicating low compositional and mineralogical maturity of the sediments. The Chemical Index of Alteration (CIA) value clearly pointing towards intense to intermediate weathering in the source area sediments. Similarly, Chemical Index of Weathering (CIW) results also supporting the same trend of weathering. The results of Plagioclase Index of Alteration (PIA) suggesting moderate destruction of feldspars during source weathering, transport, sedimentation, and diagenesis. The Ternary plot of A-CN-K and the binary plot of CIA/ICV also suggest that both geomorphological domains are immature in nature and suffered intense to moderate weathering. Trace-element concentrations in sediments result from the competing influence of provenance, weathering, diagenesis, and sediment sorting. The felsic province is also corroborated by elevated values of Ba, K, and Sr. EPMA analysis reveals the presence of heavy minerals comprising Ilmenite, garnet as major constituents followed by sphene and rutile. Other minerals include sphene, epidote, amphibole, pyroxene, biotite, apatite, chlorite, tourmaline, muscovite, and alumino-silicate. The concentration of TiO2 in Ilmenitedepicting a metamorphic signature with an igneous source. Micro-textural studies reveal different types of surface features of the grains, the various micro features have been produced by different transportational processes under different environmental conditions. Based on all geochemical and mineralogical data and different plots, it is evident that the sediments from both geomorphological domains are immature in nature and suffered intense to moderate weathering derived from mixed igneous and metamorphic sources.
| Published in | Earth Sciences (Volume 15, Issue 1) |
| DOI | 10.11648/j.earth.20261501.12 |
| Page(s) | 10-29 |
| Creative Commons |
This is an Open Access article, distributed under the terms of the Creative Commons Attribution 4.0 International License (http://creativecommons.org/licenses/by/4.0/), which permits unrestricted use, distribution and reproduction in any medium or format, provided the original work is properly cited. |
| Copyright |
Copyright © The Author(s), 2026. Published by Science Publishing Group |
Major Oxides, Trace Element, CIA, ICV, Rasulpur - Subarnarekha Complex
Lithology | Geological Unit | Age |
|---|---|---|
Sands and silts in alternate layers | Present day flood plaindeposits. | Holocene |
Fine to medium sands, greyish brown in colour | Present day beach deposits | Holocene |
Sands, white to greyish yellow in colour, well sorted | Recent Sand dune Deposit | Holocene |
Sands, silts and clays deposited in different flood regimes, no oxidation effect | Bankigarh Formation | Holocene |
Sands with silts, clays, associated with Fenodulesand Clay | Panskura Formation | Holocene |
Greenish grey clay, impregnated with calichenodules | Sijua Formation | Upper Pleistocene to Lower Holocene |
Sl No | SampleNo | SiO2 (%) | Al2O3 (%) | Fe2O3 (T)(%) | MnO (%) | MgO (%) | CaO (%) | Na2O (%) | K2O (%) | TiO2 (%) | P2O5 (%) | Total | Al2O3/TiO2 | K2O/Na2O |
|---|---|---|---|---|---|---|---|---|---|---|---|---|---|---|
1 | P-1(0) | 69.64 | 11.49 | 4.27 | 0.10 | 2.23 | 3.30 | 1.61 | 2.59 | 0.82 | 0.19 | 96.24 | 14.012 | 1.609 |
2 | P-1(1) | 66.86 | 12.40 | 5.98 | 0.12 | 2.18 | 3.16 | 1.63 | 3.44 | 0.54 | 0.23 | 96.54 | 22.963 | 2.110 |
3 | P-5(0) | 74.53 | 8.90 | 3.86 | 0.09 | 1.44 | 2.95 | 1.24 | 2.21 | 1.14 | 0.18 | 96.54 | 7.807 | 1.782 |
4 | P-5(1) | 72.43 | 9.55 | 5.30 | 0.14 | 1.39 | 2.02 | 1.39 | 2.49 | 2.11 | 0.37 | 97.19 | 4.526 | 1.791 |
5 | P-7(0) | 68.80 | 11.85 | 5.71 | 0.11 | 2.03 | 3.05 | 1.58 | 3.13 | 1.26 | 0.20 | 97.72 | 9.405 | 1.981 |
6 | P-7(1) | 78.21 | 7.75 | 3.27 | 0.08 | 0.94 | 1.86 | 1.54 | 2.25 | 1.33 | 0.14 | 97.37 | 5.827 | 1.461 |
7 | P-10(0) | 71.21 | 10.72 | 4.65 | 0.09 | 1.57 | 2.56 | 1.66 | 3.09 | 1.29 | 0.17 | 97.01 | 8.310 | 1.861 |
8 | P-10(1) | 76.18 | 8.94 | 3.33 | 0.06 | 1.06 | 1.81 | 1.49 | 2.87 | 0.81 | 0.14 | 96.69 | 11.037 | 1.926 |
9 | P-11A(0) | 69.14 | 11.76 | 4.59 | 0.10 | 2.00 | 2.67 | 1.50 | 2.77 | 0.86 | 0.20 | 95.59 | 13.674 | 1.847 |
10 | P-11A(1) | 73.55 | 11.07 | 3.58 | 0.06 | 1.26 | 1.69 | 1.83 | 3.42 | 0.43 | 0.14 | 97.03 | 25.744 | 1.869 |
11 | P-13(0) | 76.25 | 9.82 | 2.79 | 0.05 | 0.91 | 1.82 | 1.95 | 3.42 | 0.56 | 0.12 | 97.69 | 17.536 | 1.754 |
12 | P-13(1) | 80.17 | 7.39 | 2.39 | 0.05 | 0.66 | 1.34 | 1.46 | 2.81 | 0.81 | 0.12 | 97.20 | 9.123 | 1.925 |
13 | P-15(0) | 77.45 | 8.32 | 2.78 | 0.06 | 0.86 | 1.77 | 1.71 | 2.79 | 0.64 | 0.15 | 96.53 | 13.000 | 1.632 |
14 | P-15(1) | 76.52 | 7.42 | 4.67 | 0.13 | 1.03 | 2.42 | 1.14 | 2.13 | 2.82 | 0.40 | 98.68 | 2.631 | 1.868 |
15 | P-16(0) | 72.38 | 11.26 | 3.94 | 0.09 | 1.15 | 2.30 | 1.91 | 3.60 | 0.70 | 0.15 | 97.48 | 16.086 | 1.885 |
16 | P-16(1) | 78.51 | 8.71 | 3.35 | 0.06 | 1.00 | 1.80 | 1.50 | 2.92 | 0.68 | 0.15 | 98.68 | 12.809 | 1.947 |
17 | P-17/5 (0) | 83.00 | 7.36 | 2.21 | 0.03 | 0.86 | 1.42 | 1.44 | 2.08 | 0.53 | 0.07 | 99.00 | 13.887 | 1.444 |
18 | P-17/1 | 86.61 | 5.74 | 1.79 | 0.03 | 0.66 | 1.29 | 1.17 | 1.76 | 0.59 | 0.06 | 99.70 | 9.729 | 1.504 |
19 | P-18/0 (0) | 84.98 | 6.67 | 1.71 | 0.02 | 0.58 | 1.21 | 1.40 | 2.11 | 0.37 | 0.06 | 99.11 | 18.027 | 1.507 |
20 | P-18/1 | 83.28 | 7.91 | 1.55 | 0.02 | 0.46 | 0.95 | 1.74 | 2.54 | 0.28 | 0.06 | 98.79 | 28.250 | 1.460 |
21 | P-19/3 (0) | 83.78 | 7.14 | 1.96 | 0.02 | 0.60 | 1.05 | 1.43 | 2.13 | 0.42 | 0.07 | 98.60 | 17.000 | 1.490 |
22 | P-19/2 | 84.21 | 7.48 | 1.35 | 0.01 | 0.46 | 1.02 | 1.73 | 2.46 | 0.21 | 0.05 | 98.98 | 35.619 | 1.422 |
23 | P-20/1 | 84.95 | 6.50 | 1.81 | 0.04 | 0.67 | 1.33 | 1.51 | 2.11 | 0.77 | 0.05 | 99.74 | 8.442 | 1.397 |
24 | P-20/3 | 84.83 | 6.98 | 1.56 | 0.02 | 0.45 | 1.02 | 1.68 | 2.36 | 0.29 | 0.04 | 99.23 | 24.069 | 1.405 |
25 | P-21/1 | 84.63 | 7.17 | 1.30 | 0.01 | 0.48 | 0.96 | 1.40 | 2.37 | 0.28 | 0.06 | 98.66 | 25.607 | 1.693 |
26 | P-21/3 | 87.25 | 6.15 | 0.96 | 0.00 | 0.19 | 0.62 | 1.53 | 2.49 | 0.08 | 0.05 | 99.32 | 76.875 | 1.627 |
27 | P-22/1 | 88.52 | 5.17 | 1.19 | 0.01 | 0.46 | 0.92 | 1.23 | 1.80 | 0.27 | 0.03 | 99.60 | 19.148 | 1.463 |
28 | P-22/3 | 85.67 | 7.04 | 0.97 | 0.01 | 0.32 | 0.86 | 1.66 | 2.59 | 0.17 | 0.05 | 99.34 | 41.412 | 1.560 |
29 | P-23/1 | 80.76 | 7.58 | 3.16 | 0.08 | 1.06 | 2.07 | 1.40 | 2.10 | 1.52 | 0.09 | 99.82 | 4.987 | 1.500 |
30 | P-23/3 | 77.14 | 9.81 | 3.37 | 0.06 | 1.29 | 1.90 | 1.83 | 2.51 | 0.79 | 0.11 | 98.81 | 12.418 | 1.372 |
31 | P-24/1 | 81.62 | 7.80 | 2.47 | 0.05 | 0.85 | 1.72 | 1.69 | 2.26 | 1.02 | 0.09 | 99.57 | 7.647 | 1.337 |
32 | P-24/5 | 81.96 | 7.45 | 2.59 | 0.06 | 0.94 | 1.87 | 1.44 | 2.17 | 0.99 | 0.09 | 99.56 | 7.525 | 1.507 |
33 | P-25/1 | 81.81 | 6.50 | 3.36 | 0.09 | 1.14 | 2.15 | 1.34 | 1.93 | 1.72 | 0.08 | 100.12 | 3.779 | 1.440 |
34 | P-25/3 | 84.27 | 6.85 | 1.80 | 0.04 | 0.68 | 1.41 | 1.50 | 2.22 | 0.55 | 0.06 | 99.38 | 12.455 | 1.480 |
35 | PASS | 62.8 | 18.9 | 6.5 | 0.11 | 2.2 | 1.3 | 1.2 | 3.7 | 1 | 0.16 | 97.87 | 18.900 | 3.083 |
SL NO | Sample No | SiO2 (%) | Al2O3 (%) | Fe2O3 (T)(%) | MnO (%) | MgO (%) | CaO (%) | Na2O (%) | K2O (%) | TiO2 (%) | P2O5 (%) | Total | Al2O3/TiO2 | K2O/Na2O |
|---|---|---|---|---|---|---|---|---|---|---|---|---|---|---|
1 | BS-05 | 54.34 | 17.18 | 7.62 | 0.14 | 3.09 | 2.04 | 0.82 | 3.67 | 1.03 | 0.15 | 90.08 | 16.680 | 4.476 |
2 | BS-19 | 56.61 | 16.99 | 6.40 | 0.11 | 3.11 | 2.49 | 0.96 | 3.50 | 0.98 | 0.15 | 91.30 | 17.337 | 3.646 |
3 | BS-28 | 54.95 | 17.48 | 6.73 | 0.12 | 3.06 | 2.20 | 1.14 | 3.49 | 1.04 | 0.14 | 90.35 | 16.808 | 3.061 |
4 | BS-39 | 51.97 | 17.84 | 8.54 | 0.13 | 3.27 | 1.53 | 0.77 | 3.74 | 1.06 | 0.15 | 89.00 | 16.830 | 4.857 |
5 | BS-45 | 55.37 | 16.79 | 7.17 | 0.13 | 3.06 | 2.00 | 0.89 | 3.65 | 1.03 | 0.15 | 90.24 | 16.301 | 4.101 |
6 | BS-51 | 53.97 | 17.56 | 7.71 | 0.13 | 3.20 | 1.82 | 0.85 | 3.77 | 1.03 | 0.14 | 90.18 | 17.049 | 4.435 |
7 | BS-68 | 51.86 | 17.36 | 9.06 | 0.14 | 3.27 | 1.29 | 0.79 | 3.84 | 1.06 | 0.14 | 88.81 | 16.377 | 4.861 |
8 | BS-35 | 53.81 | 17.74 | 7.81 | 0.12 | 3.14 | 1.86 | 0.92 | 3.59 | 1.03 | 0.14 | 90.16 | 17.223 | 3.902 |
9 | BS-01 | 65.63 | 13.50 | 5.21 | 0.12 | 2.56 | 3.66 | 1.19 | 2.54 | 1.61 | 0.20 | 96.22 | 8.385 | 2.134 |
10 | BS-01 | 73.44 | 11.77 | 4.43 | 0.09 | 1.20 | 1.85 | 1.87 | 2.93 | 2.36 | 0.11 | 100.05 | 4.987 | 1.567 |
11 | BS-10 | 83.35 | 8.25 | 1.43 | 0.02 | 0.55 | 1.10 | 1.70 | 2.47 | 0.55 | 0.04 | 99.46 | 15.000 | 1.453 |
12 | BS-22 | 84.84 | 6.35 | 2.60 | 0.02 | 0.32 | 0.84 | 1.47 | 2.21 | 0.46 | 0.06 | 99.17 | 13.804 | 1.503 |
13 | BS-37 | 78.20 | 10.92 | 1.67 | 0.03 | 0.81 | 1.76 | 2.39 | 2.83 | 0.74 | 0.03 | 99.38 | 14.757 | 1.184 |
14 | BS-43 | 79.66 | 9.61 | 2.41 | 0.03 | 0.85 | 1.50 | 1.84 | 2.43 | 0.78 | 0.07 | 99.18 | 12.321 | 1.321 |
15 | BS-47 | 86.62 | 6.23 | 1.18 | 0.02 | 0.50 | 0.93 | 1.44 | 2.27 | 0.22 | 0.05 | 99.46 | 28.318 | 1.576 |
16 | BS-52 | 83.30 | 6.92 | 2.30 | 0.06 | 0.78 | 1.74 | 1.46 | 2.12 | 1.09 | 0.03 | 99.80 | 6.349 | 1.452 |
17 | BS-61 | 73.77 | 11.31 | 3.78 | 0.08 | 1.10 | 2.20 | 2.19 | 3.26 | 1.96 | 0.05 | 99.70 | 5.770 | 1.489 |
18 | BS-66 | 77.88 | 8.77 | 3.99 | 0.10 | 1.04 | 2.12 | 1.62 | 2.38 | 2.46 | 0.05 | 100.41 | 3.565 | 1.469 |
SL NO | Sample No | Ba | Co | Cr | Cu | Ga | Nb | Ni | Pb | Sc | Sr | V | Y | Zn | Zr | Total | Zr/Sc |
|---|---|---|---|---|---|---|---|---|---|---|---|---|---|---|---|---|---|
1 | P-1(1) | 553 | 16 | 136 | 16 | 10 | 10 | 42 | 24 | 8 | 111 | 64 | 21 | 52 | 440 | 1503 | 55 |
2 | P-1(0) | 435 | 12 | 132 | 12 | 10 | 14 | 28 | 18 | 7 | 96 | 63 | 31 | 51 | 365 | 1274 | 52 |
3 | P-5(1) | 644 | 12 | 248 | 7 | 8 | 29 | 47 | 23 | 6 | 83 | 87 | 72 | 46 | 887 | 2199 | 148 |
4 | P-5(0) | 393 | 8 | 142 | 11 | 7 | 16 | 19 | 12 | 10 | 77 | 65 | 40 | 35 | 557 | 1392 | 56 |
5 | P-7(1) | 519 | 8 | 166 | 13 | 7 | 19 | 19 | 16 | 5 | 92 | 63 | 43 | 37 | 782 | 1789 | 156 |
6 | P-7(0) | 562 | 13 | 177 | 11 | 9 | 18 | 43 | 18 | 12 | 93 | 84 | 39 | 40 | 486 | 1605 | 41 |
7 | P-10(1) | 641 | 10 | 230 | <1 | 5 | 5 | 26 | 41 | 7 | 111 | 61 | 25 | 31 | 189 | 1382 | 27 |
8 | P-10(0) | 630 | 13 | 208 | <1 | 9 | 15 | 23 | 33 | 8 | 138 | 79 | 45 | 44 | 507 | 1752 | 63 |
9 | P-11A(1) | 674 | 10 | 146 | <1 | 5 | 3 | 14 | 44 | 8 | 129 | 52 | 11 | 27 | 50 | 1173 | 6 |
10 | P-11A(0) | 546 | 11 | 158 | <1 | 7 | 7 | 13 | 27 | 8 | 109 | 72 | 30 | 41 | 225 | 1254 | 28 |
11 | P-13(1) | 613 | 8 | 195 | 11 | 6 | 12 | 41 | 15 | 7 | 78 | 45 | 21 | 26 | 400 | 1478 | 57 |
12 | P-13(0) | 696 | 7 | 154 | 12 | 7 | 8 | 34 | 15 | 5 | 83 | 47 | 16 | 25 | 201 | 1310 | 40 |
13 | P-15(1) | 717 | 13 | 370 | 4 | 7 | 36 | 37 | 19 | 10 | 85 | 97 | 80 | 50 | 1502 | 3027 | 150 |
14 | P-15(0) | 607 | 10 | 117 | 14 | 6 | 11 | 26 | 14 | 6 | 79 | 48 | 21 | 25 | 281 | 1265 | 47 |
15 | P-16(1) | 588 | 9 | 164 | 13 | 6 | 11 | 45 | 15 | 6 | 77 | 55 | 19 | 27 | 213 | 1248 | 36 |
16 | P-16(0) | 683 | 11 | 169 | 13 | 8 | 11 | 38 | 17 | 5 | 97 | 55 | 21 | 29 | 256 | 1413 | 51 |
17 | P-17/5 (0) | 473 | 6 | 57 | 3 | 7 | 9 | 15 | 15 | 5 | 114 | 40 | 18 | 17 | 211 | 990 | 42 |
18 | P-17/1 | 438 | 1 | 73 | 1 | 6 | 8 | 11 | 13 | 4 | 96 | 38 | 17 | 13 | 245 | 964 | 61 |
19 | P-18/0 (0) | 490 | 4 | 51 | 4 | 7 | 8 | 13 | 17 | 4 | 114 | 29 | 12 | 10 | 136 | 899 | 34 |
20 | P-18/1 | 564 | 5 | 45 | 11 | 7 | 6 | 9 | 22 | 4 | 126 | 25 | 12 | 10 | 136 | 982 | 34 |
21 | P-19/3 (0) | 471 | 4 | 54 | 6 | 7 | 9 | 10 | 16 | 4 | 104 | 33 | 15 | 12 | 169 | 914 | 42 |
22 | P-19/2 | 523 | 2 | 36 | 3 | 7 | 6 | 11 | 17 | 4 | 126 | 21 | 8 | 10 | 84 | 858 | 21 |
23 | P-20/1 | 487 | 4 | 84 | 2 | 6 | 10 | 11 | 15 | 5 | 114 | 45 | 19 | 13 | 301 | 1116 | 60 |
24 | P-20/3 | 542 | 5 | 50 | 1 | 8 | 7 | 10 | 18 | 4 | 118 | 27 | 9 | 10 | 124 | 933 | 31 |
25 | P-21/1 | 540 | 4 | 75 | 7 | 7 | 6 | 16 | 12 | 4 | 110 | 25 | 6 | 10 | 95 | 917 | 24 |
26 | P-21/3 | 554 | 2 | 17 | 1 | 5 | 5 | 7 | 15 | 4 | 113 | 20 | 11 | 10 | 63 | 827 | 16 |
27 | P-22/1 | 410 | 1 | 46 | 1 | 5 | 6 | 9 | 10 | 4 | 84 | 26 | 15 | 10 | 91 | 718 | 23 |
28 | P-22/3 | 572 | 1 | 42 | 2 | 5 | 5 | 9 | 13 | 4 | 122 | 20 | 4 | 10 | 75 | 884 | 19 |
29 | P-23/1 | 557 | 5 | 149 | 10 | 10 | 16 | 17 | 34 | 5 | 131 | 71 | 41 | 32 | 607 | 1685 | 121 |
30 | P-23/3 | 584 | 12 | 87 | 26 | 9 | 11 | 28 | 23 | 7 | 153 | 58 | 24 | 33 | 301 | 1356 | 43 |
31 | P-24/1 | 560 | 6 | 106 | 17 | 9 | 12 | 15 | 25 | 5 | 136 | 54 | 30 | 40 | 430 | 1445 | 86 |
32 | P-24/5 | 522 | 8 | 115 | 4 | 8 | 12 | 15 | 20 | 7 | 133 | 59 | 24 | 22 | 342 | 1291 | 49 |
33 | P-25/1 | 521 | 7 | 183 | 6 | 8 | 15 | 19 | 19 | 8 | 118 | 75 | 45 | 39 | 558 | 1621 | 70 |
34 | P-25/3 | 520 | 7 | 62 | 2 | 7 | 8 | 12 | 21 | 6 | 122 | 36 | 15 | 14 | 170 | 1002 | 28 |
35 | PASS | 650 | - | 110 | 28 | 17.5 | 19 | 55 | 20 | 16 | 200 | 150 | 27 | 67 | 210 | 1570 | 13 |
SL NO | Sample No | Ba | Co | Cr | Cu | Ga | Nb | Ni | Pb | Sc | Sr | V | Y | Zn | Zr | Total | Zr/Sc |
|---|---|---|---|---|---|---|---|---|---|---|---|---|---|---|---|---|---|
1 | BS-05(G) | 602 | 19 | 148 | 57 | 20 | 19 | 59 | 21 | 24 | 99 | 160 | 35 | 102 | 272 | 1637 | 11 |
2 | BS-19(G) | 604 | 21 | 143 | 61 | 21 | 19 | 61 | 26 | 20 | 100 | 155 | 34 | 103 | 260 | 1628 | 13 |
3 | BS-28(G) | 588 | 15 | 153 | 42 | 19 | 19 | 50 | 20 | 17 | 105 | 139 | 40 | 88 | 372 | 1667 | 22 |
4 | BS-39(G) | 476 | 14 | 186 | 19 | 12 | 22 | 30 | 27 | 12 | 133 | 118 | 69 | 56 | 927 | 2101 | 77 |
5 | BS-45(G) | 607 | 19 | 148 | 56 | 19 | 19 | 57 | 23 | 18 | 100 | 152 | 35 | 97 | 218 | 1568 | 12 |
6 | BS-51(G) | 617 | 18 | 150 | 55 | 21 | 19 | 62 | 24 | 18 | 100 | 163 | 32 | 108 | 185 | 1572 | 10 |
7 | BS-68(G) | 602 | 22 | 165 | 79 | 21 | 20 | 72 | 19 | 24 | 92 | 189 | 30 | 124 | 147 | 1606 | 6 |
8 | BS-35(G) | 585 | 15 | 134 | 43 | 19 | 18 | 50 | 23 | 18 | 107 | 133 | 39 | 85 | 342 | 1611 | 19 |
9 | BS-01(G) | 594 | 20 | 156 | 61 | 20 | 20 | 64 | 26 | 23 | 96 | 183 | 33 | 110 | 207 | 1613 | 9 |
10 | BS-01 | 698 | 11 | 260 | 10 | 12 | 28 | 28 | 35 | 11 | 144 | 109 | 74 | 36 | 1389 | 2845 | 126 |
11 | BS-10 | 565 | 4 | 85 | 2 | 9 | 9 | 10 | 19 | 6 | 126 | 38 | 21 | 10 | 269 | 1173 | 45 |
12 | BS-22 | 505 | 5 | 130 | 13 | 8 | 7 | 25 | 20 | 4 | 110 | 43 | 16 | 12 | 288 | 1186 | 72 |
13 | BS-37 | 658 | 7 | 99 | 7 | 11 | 13 | 21 | 19 | 8 | 169 | 47 | 16 | 12 | 235 | 1322 | 29 |
14 | BS-43 | 537 | 8 | 102 | 5 | 11 | 12 | 17 | 20 | 7 | 142 | 50 | 22 | 15 | 314 | 1262 | 45 |
15 | BS-47 | 525 | 4 | 60 | 1 | 6 | 6 | 11 | 19 | 4 | 110 | 23 | 13 | 10 | 86 | 878 | 22 |
16 | BS-52 | 525 | 3 | 123 | 3 | 9 | 12 | 13 | 16 | 7 | 126 | 55 | 29 | 22 | 378 | 1321 | 54 |
17 | BS-61 | 801 | 7 | 244 | 9 | 11 | 22 | 33 | 30 | 7 | 176 | 95 | 50 | 28 | 801 | 2314 | 114 |
18 | BS-66 | 659 | 12 | 276 | 12 | 11 | 23 | 33 | 26 | 7 | 144 | 109 | 79 | 36 | 1283 | 2710 | 183 |
19 | PASS | 650 | - | 110 | 28 | 17.5 | 19 | 55 | 20 | 16 | 200 | 150 | 27 | 67 | 210 | 1570 | 13 |
SL NO. | Sample No | CIA | ICV | CIW | PIA | CIA/1CV |
|---|---|---|---|---|---|---|
1 | P-1(1) | 60.107 | 1.331 | 72.135 | 43.432 | 45.144 |
2 | P-1(0) | 60.506 | 1.227 | 70.061 | 46.867 | 49.306 |
3 | P-5(1) | 61.812 | 1.333 | 73.688 | 45.696 | 46.371 |
4 | P-5(0) | 58.170 | 1.325 | 67.991 | 43.725 | 43.911 |
5 | P-7(1) | 57.836 | 1.283 | 69.507 | 41.045 | 45.093 |
6 | P-7(0) | 60.428 | 1.317 | 71.905 | 44.467 | 45.873 |
7 | P-10(1) | 59.166 | 1.188 | 73.039 | 40.172 | 49.807 |
8 | P-10(0) | 59.456 | 1.271 | 71.754 | 42.318 | 46.797 |
9 | P-11A(1) | 61.466 | 1.070 | 75.874 | 42.476 | 57.468 |
10 | P-11A(0) | 62.888 | 1.159 | 73.823 | 48.075 | 54.260 |
11 | P-13(1) | 56.846 | 1.179 | 72.522 | 35.231 | 48.231 |
12 | P-13(0) | 57.731 | 1.114 | 72.259 | 37.625 | 51.820 |
13 | P-15(1) | 56.598 | 1.553 | 67.577 | 40.351 | 36.455 |
14 | P-15(0) | 57.025 | 1.198 | 70.508 | 37.903 | 47.588 |
15 | P-16(1) | 58.339 | 1.220 | 72.523 | 38.781 | 47.802 |
16 | P-16(0) | 59.046 | 1.154 | 72.786 | 40.168 | 51.182 |
17 | P-17/5 (0) | 59.837 | 1.092 | 72.016 | 42.927 | 54.777 |
18 | P-17/1 | 57.631 | 1.167 | 70.000 | 39.960 | 49.373 |
19 | P-18/0 (0) | 58.560 | 1.054 | 71.875 | 40.035 | 55.561 |
20 | P-18/1 | 60.198 | 0.918 | 74.623 | 40.868 | 65.587 |
21 | P-19/3 (0) | 60.766 | 1.007 | 74.220 | 42.638 | 60.343 |
22 | P-19/2 | 58.944 | 0.940 | 73.118 | 39.559 | 62.717 |
23 | P-20/1 | 56.769 | 1.149 | 69.593 | 38.341 | 49.397 |
24 | P-20/3 | 57.973 | 1.016 | 72.107 | 38.372 | 57.074 |
25 | P-21/1 | 60.252 | 0.909 | 75.236 | 40.336 | 66.259 |
26 | P-21/3 | 56.997 | 0.942 | 74.096 | 33.920 | 60.510 |
27 | P-22/1 | 56.689 | 1.085 | 70.628 | 36.952 | 52.242 |
28 | P-22/3 | 57.942 | 0.911 | 73.640 | 36.626 | 63.637 |
29 | P-23/1 | 57.643 | 1.302 | 68.597 | 41.673 | 44.269 |
30 | P-23/3 | 61.121 | 1.117 | 72.452 | 45.483 | 54.708 |
31 | P-24/1 | 57.906 | 1.159 | 69.581 | 41.128 | 49.964 |
32 | P-24/5 | 57.618 | 1.217 | 69.238 | 40.835 | 47.327 |
33 | P-25/1 | 54.530 | 1.540 | 65.065 | 38.339 | 35.409 |
34 | P-25/3 | 57.179 | 1.117 | 70.184 | 38.648 | 51.199 |
35 | PASS | 0.850 |
SL NO | Sample No | CIA | ICV | CIW | PIA | CIA/1CV |
|---|---|---|---|---|---|---|
1 | BS-05(G) | 72.459 | 1.012 | 85.729 | 56.980 | 71.625 |
2 | BS-19(G) | 70.969 | 0.975 | 83.121 | 56.349 | 72.768 |
3 | BS-28(G) | 71.905 | 0.958 | 83.958 | 57.548 | 75.083 |
4 | BS-39(G) | 74.707 | 1.008 | 88.580 | 59.045 | 74.125 |
5 | BS-45(G) | 71.967 | 1.007 | 85.315 | 56.322 | 71.499 |
6 | BS-51(G) | 73.167 | 0.995 | 86.802 | 57.458 | 73.502 |
7 | BS-68(G) | 74.570 | 1.059 | 89.300 | 58.076 | 70.394 |
8 | BS-35(G) | 73.579 | 0.983 | 86.452 | 58.689 | 74.845 |
9 | BS-01(G) | 64.624 | 1.132 | 73.569 | 52.465 | 57.096 |
10 | BS-01 | 63.898 | 1.051 | 75.985 | 47.991 | 60.799 |
11 | BS-10 | 61.021 | 0.881 | 74.661 | 42.751 | 69.246 |
12 | BS-22 | 58.418 | 1.175 | 73.326 | 38.086 | 49.725 |
13 | BS-37 | 61.006 | 0.869 | 72.462 | 45.196 | 70.198 |
14 | BS-43 | 62.484 | 0.943 | 74.208 | 46.684 | 66.277 |
15 | BS-47 | 57.314 | 1.018 | 72.442 | 36.431 | 56.319 |
16 | BS-52 | 56.536 | 1.223 | 68.379 | 39.216 | 46.245 |
17 | BS-61 | 59.652 | 1.115 | 72.038 | 42.458 | 53.502 |
18 | BS-66 | 58.899 | 1.283 | 70.104 | 42.915 | 45.915 |
XRF | X-ray Fluorescence Spectrometry Technique |
ICV | Index of Compositional Variability |
CIA | Chemical Index of Alteration |
CIW | Chemical Index of Weathering Results |
PIA | Plagioclase Index of Alteration |
| [1] | Al-Juboury A 2007 Petrography and major element geochemistry of Late Triassic Carpathian keuper sandstones: Implications for provenance; Bulletine de I’InstituteScientiBque, Rabat, section science de la Terre 29 1–14. |
| [2] | Armstrong-Altrin JS, Lee YI, Verma SP, Ramasamy S (2004) Geochemistry of sandstones from the upper Miocene Kudankulam Formation, Southern India: implications for provenance, weathering, and tectonic setting. J Sediment Res 74(2): 285–297. |
| [3] | Armstrong-Altrin JS, Lee YI, Kasper-Zubillaga JJ, Carranza-Edwards A, Garcia D, Eby N, Balaram V, Cruz-Ortiz NL (2012) Geochemistry of beach sands along the Western Gulf of Mexico, Mexico: implication for provenance. ChemErde-Geochem 72(4): 345–362. |
| [4] | Armstrong-Altrin JS, Nagarajan R, Madhavaraju J, Rosalez-Hoz L, Lee YI, Balaram V, Cruz-Martinez A, Avila-Ramirez G (2013) Geochemistry of Jurassic and upper Cretaceous shales from the Molango Region, Hidalgo, Eastern Mexico: implications for source-area weathering, provenance, and tectonic setting. ComptRendusGeosci 345(4): 185–202. |
| [5] | Armstrong-Altrin JS (2015) Evaluation of two multi-dimensional discrimination diagrams from beach and deep sea sediments from the Gulf of Mexico and their application to Precambrian clastic sedimentary rocks. IntGeol Rev 57(11–12): 1446–1461. |
| [6] | Bakkiaraj D, Nagendra R, Nagarajan R, Armstrong-Altrin JS (2010) Geochemistry of sandstones from the Upper Cretaceous Sillakkudi Formation, Cauvery Basin, Southern India: implication for provenance. J Geol Soc India 76(5): 453–467. |
| [7] | Bauluz, (2000) Geochemistry of Precambrian and Paleozoic siliciclastic rocks from the Iberian Range (NE Spain): implications for source-area weathering, sorting, provenance, and tectonic setting. Elsevier, volume-168, Pages 135-150. |
| [8] | Bhatia M R 1983 Plate tectonics and geochemical composition of sandstones; J. Geol. 91, 611–627. |
| [9] | Bhatia MR, Crook KAW (1986) Trace element characteristics of graywackes and tectonic setting discrimination of sedimentary basins. Contrib Mineral Petrol 92(2): 181–193. |
| [10] | Bhuiyan M A H, Rahman M J J, Dampare S B and Suzuki S 2011 Provenance, tectonics and source weathering of modern Cuvial sediments of the Brahmaputra–Jamuna River, Bangladesh: Inference from geochemistry; J. Geochem. Expl. 111, 113–137. |
| [11] | Bull PA (1981) Environmental reconstruction by electron microcopy. ProgPhysGeogr 5: 368–397. |
| [12] | Chattopadhyay, G. S. and Mukherjee, S (1975) Geological Quadrangle Map based on theSurvey of India Map No. 73O Second Edition. |
| [13] | Chakrabarti, P (1991) Process-response system analysis in the macrotidal Estuarine and mesotidal coastal plain of eastern India. GeolSoc India Mem 22: 165–181. |
| [14] | Cullers R L 1994 The controls on the major and trace element variation of shales, siltstones and sandstones of Pennsylvanian– Permian age from uplifted continental blocks in Colorado to platform sediment in Kansas, USA; Geochim. Cosmochim. Acta 58, 4955–4972. |
| [15] | Cullers R L 2000 The geochemistry of shales, siltstones and sandstones of Pennsylvanian–Permian age, Colorado, USA: Implications for provenance and metamorphic studies; Lithos 51, 181–203. |
| [16] | Fedo CM, Nesbitt HW, Young GM (1995) Unravelling the effects of potassium metasomatism in sedimentary rocks and palaeosoils, with implications for palaeoweathering conditions and provenance. Geology 23: 921–924. |
| [17] | Frost, M., Grey, I., Harrowfield, I. & Mason, K., 1983 The dependence of alumina and silica contents on the extent of alteration of weathered ilmenites from Western Australia. Mineral. Mag. 47(343): 201. |
| [18] | Harnois, L. (1988). The CIW index: A new chemical index of weathering. Sedimentary Geology, 55(3-4), 319-322. |
| [19] | Hayashi, K. I., Fujisawa, H., Holland, H. D. and Ohmoto, H. (1997) Geochemistry of 1.9 Ga sedimentary rocks from northeastern Labrador, Canada. Geochim. Cosmochim. Acta, v.61, pp. 4115–4137. |
| [20] | Krinsley DH, Donahue J (1968) Environmental interpretation of sand grain surface textures by electron Microscopy. Geol Soc Am Bull 79: 743–748. |
| [21] | Krinsley DH, Friend P, Klimentidis R (1976) Eolian transport textures on the surface of sand grains of early triassic age. GeolSocAmBull 87: 130–132. |
| [22] | Krinsley DH, McCoy FW (1977) Significance and origin of surface textures on broken sand grains in deep sea sediments. Sedimentology 24: 857–862. |
| [23] | Long X, Yuan C, Sun M, Xiao W, Wang Y, Cai K, Jiang Y (2012) Geochemistry and Nd isotopic composition of the Early Paleozoic flysch sequence in the Chinese Altai, Central Asia: evidence for a northward-derived mafic source and insight into model ages in an accretionaryorogen. Gondwana Res 22: 554–566. |
| [24] | Madhavaraju J, García JC, HussainSM, Mohan SP (2009) Microtextures on quartz grains in the beach sediments of Puerto Peñasco and Bahia Kino, Gulf of California, Sonora, Mexico. Revista Mexicana de CienciasGeológicas 26(2): 367–379. |
| [25] | Madhavaraju J, Loser H, Lee Y I, Lozano-Santacruz R and Pi-Puig T 2016a Geochemistry of Lower Cretaceous LimeStones of the Alisitos Formation, Baja California, Mexico: Implications for REE source and paleo-redox conditions; J. South Am. Earth Sci. 66 149–165. |
| [26] | Margolis SV, Krinsley DH (1974) Process of formation and environmental occurrence of microfeatures on detrital quartz grains. Am J Sci 274: 449–64. |
| [27] | McLennan SM, Taylor SR (1991) Sedimentary rocks and crustal evolution: tectonic setting and secular trends. J Geol 99(1): 1–21. |
| [28] | McLennan SM, Hemming S, McDaniel DK, Hanson GN (1993) Geochemical approaches to sedimentation, provenance, and 61 Page 12 of 14 Arab J Geosci (2018) 11: 61 tectonics. Geol Soc Am Spec Pap 284: 21–40. |
| [29] |
Moral Cardona JP, Gutiérrez-Mas JM, Sánchez Bellón A, LópezAguayo F, Caballero MA (1997b) Provenance of multicycle quartz arenites of Pliocene age at Arcos, Southwestern Spain. Sediment Geol 112: 251–261.
https://doi.org/10.1016/S0037-738%2897%2900040-7#doilink, http://dx.doi.org/10.1016/S0037-0738(97)00040-7 |
| [30] | Nesbitt, H. W., Young, G. M., Early Proterozoic climates and plate motions inferred from major element chemistry of lutites. Nature, 1982, 299, 715-717. |
| [31] | Nesbitt HW (2003) Petrogenesis of siliciclastic sediments and sedimentary rocks. In: Lentz DR (ed) Geochemistry of sediments and sedimentary rocks: evolutionary considerations to mineraldeposit-forming environments. GeolAssoc Canada GEOText 4: 39–52. |
| [32] | Rahman J J M and Suzuki S 2007 Geochemistry of sandstones from the Miocene Surma Group, Bengal Basin, Bangladesh: Implications for Provenance, tectonic setting and weathering; Geochem. J. 41: 415–428. |
| [33] | Rollinson H. R., 1983, The geochemistry of mafic and ultramafic rocks from the Archaean greenstone belts of Sierra Leone. Mineral. Mag., 47, 267-280. |
| [34] | Roser B P and Korsch R J 1988 Provenance signatures of sandstone–mudstone suites determined using discrimination function analysis of major element data; Chem. Geol. 67 119–139. |
| [35] | Roser B P, Cooper R A, Nathan S and Tulloch A J 1996 Reconnaissance sandstone geochemistry, provenance, and tectonic setting of the lower Paleozoic terranes of the West Coast and Nelson, New Zealand; J. Geol. Geophys. 39 1–16. |
| [36] | Rónadh Cox, Donald R. Lowe, R. L. Cullers (July, 1995), “The influence of sediment recycling and basement composition on evolution of mudrock chemistry in the southwestern United States”, Geochemica et Cosmochimica Acta, Science Direct, Vol. 59, Issues- 14, pp. 2919-2940. |
| [37] | Rudnick R. L., Gao S., Composition of the continental crust. Treatise of Geochemistry, 2003, 3, 1-64. |
| [38] | Suttner, L. J., &Dutta, P. K. (1986). Alluvial sandstone composition and palaeo-climate, 1. Framework mineralogy. J. Sed. Pet., 56(3), 32. |
| [39] | Tapas Kumar Mallik Geologist (Sr). Paper on Micromorphology of some quartz grains in marine placer deposits, Marine Geology, 1986, Elsevier. |
| [40] | Taylor SR, McLennan SM (eds) (1985) The continental crust: its composition and evolution. Blackwell Scientific Publications, Oxford, 1985, 312 pp. |
| [41] | T. K. Mallik, V. Vasudevan, P. Aby Verghese, Terry Machado (1987), “The black sand placer deposits of Kerala beach, southwest India”, Marine Geology, Elsevier, Vol. 77, Issues- 1-2, pp. 129-150. |
| [42] | vonEynatten H, Barcelo´-Vidal C, Pawlowsky-Glahn V (2003) Composition and discrimination of sandstones: a stochastic evaluation of different analytical methods. J Sed Res 73: 47–57. |
| [43] |
KARL K. TUREKIAN, KARL HANS WEDEPOHL;(1961); “Distribution of the Elements in Some Major Units of the Earth's Crust”, Geological society of America bulletin, GSA Bulletin (1961) 72(2): 175–192.
https://doi.org/10.1130/0016-7606(1961)72[175:DOTEIS]2.0.CO;2 |
| [44] | Lee J. Suttner; Prodip K. Dutta,(May 01, 1986); Alluvial sandstone composition and paleoclimate; I, Framework mineralogy Journal of Sedimentary Research (1986) 56(3): 329–345. |
APA Style
Guha, P. D., Mukherjee, S., Sahoo, A. K., Dutta, S., Kumar, A. A., et al. (2026). Geochemical Characterization of Rasulpur - Subarnarekha River Mouths Estuarine Complex, EC of India: Provenance, Palaeo Weathering and Depositional Environment. Earth Sciences, 15(1), 10-29. https://doi.org/10.11648/j.earth.20261501.12
ACS Style
Guha, P. D.; Mukherjee, S.; Sahoo, A. K.; Dutta, S.; Kumar, A. A., et al. Geochemical Characterization of Rasulpur - Subarnarekha River Mouths Estuarine Complex, EC of India: Provenance, Palaeo Weathering and Depositional Environment. Earth Sci. 2026, 15(1), 10-29. doi: 10.11648/j.earth.20261501.12
AMA Style
Guha PD, Mukherjee S, Sahoo AK, Dutta S, Kumar AA, et al. Geochemical Characterization of Rasulpur - Subarnarekha River Mouths Estuarine Complex, EC of India: Provenance, Palaeo Weathering and Depositional Environment. Earth Sci. 2026;15(1):10-29. doi: 10.11648/j.earth.20261501.12
@article{10.11648/j.earth.20261501.12,
  author = {Priyanka Dey Guha and Snehalata Mukherjee and Ashwin Kumar Sahoo and Subhankar Dutta and Adukadukkam Anil Kumar and Cheruvathoor Vannathan Gopalan},
  title = {Geochemical Characterization of Rasulpur - Subarnarekha River Mouths Estuarine Complex, EC of India: Provenance, Palaeo Weathering and Depositional Environment},
  journal = {Earth Sciences},
  volume = {15},
  number = {1},
  pages = {10-29},
  doi = {10.11648/j.earth.20261501.12},
  url = {https://doi.org/10.11648/j.earth.20261501.12},
  eprint = {https://article.sciencepublishinggroup.com/pdf/10.11648.j.earth.20261501.12},
  abstract = {Major and trace element geochemistry of sediments is a very useful tool for understanding the provenance, intensity of weathering, tectonic settings, and depositional environment of the sediments. Sediments collected from different geomorphic domains (onshore and nearshore) of Rasulpur to Subarnarekha River mouths estuarine complex, East coast of India, were analyzed for their geochemical (major, trace contents) and mineralogical characteristics to determine their provenance, compositional maturity, paleo-weathering condition, and depositional environment. From geochemical studies, it is evident that the samples from the nearshore area suffered more weathering than the onshore samples. Geochemistry of the sediments suggests the protolith of the area to be of intermediate to felsic source rocks. A relative increase in the Al2O3/TiO2 ratio in sediments also suggests that they are derived mainly from intermediate to felsic source rocks. A strong positive correlation between Fe2O3, MnO, K2O, MgO, CaO, P2O5, and major oxides with respect to Al2O3 indicates that they are associated with micaceous/clay minerals. The Index of Compositional Variability (ICV) indicating low compositional and mineralogical maturity of the sediments. The Chemical Index of Alteration (CIA) value clearly pointing towards intense to intermediate weathering in the source area sediments. Similarly, Chemical Index of Weathering (CIW) results also supporting the same trend of weathering. The results of Plagioclase Index of Alteration (PIA) suggesting moderate destruction of feldspars during source weathering, transport, sedimentation, and diagenesis. The Ternary plot of A-CN-K and the binary plot of CIA/ICV also suggest that both geomorphological domains are immature in nature and suffered intense to moderate weathering. Trace-element concentrations in sediments result from the competing influence of provenance, weathering, diagenesis, and sediment sorting. The felsic province is also corroborated by elevated values of Ba, K, and Sr. EPMA analysis reveals the presence of heavy minerals comprising Ilmenite, garnet as major constituents followed by sphene and rutile. Other minerals include sphene, epidote, amphibole, pyroxene, biotite, apatite, chlorite, tourmaline, muscovite, and alumino-silicate. The concentration of TiO2 in Ilmenitedepicting a metamorphic signature with an igneous source. Micro-textural studies reveal different types of surface features of the grains, the various micro features have been produced by different transportational processes under different environmental conditions. Based on all geochemical and mineralogical data and different plots, it is evident that the sediments from both geomorphological domains are immature in nature and suffered intense to moderate weathering derived from mixed igneous and metamorphic sources.},
 year = {2026}
}
TY  - JOUR
T1  - Geochemical Characterization of Rasulpur - Subarnarekha River Mouths Estuarine Complex, EC of India: Provenance, Palaeo Weathering and Depositional Environment
AU  - Priyanka Dey Guha
AU  - Snehalata Mukherjee
AU  - Ashwin Kumar Sahoo
AU  - Subhankar Dutta
AU  - Adukadukkam Anil Kumar
AU  - Cheruvathoor Vannathan Gopalan
Y1  - 2026/02/02
PY  - 2026
N1  - https://doi.org/10.11648/j.earth.20261501.12
DO  - 10.11648/j.earth.20261501.12
T2  - Earth Sciences
JF  - Earth Sciences
JO  - Earth Sciences
SP  - 10
EP  - 29
PB  - Science Publishing Group
SN  - 2328-5982
UR  - https://doi.org/10.11648/j.earth.20261501.12
AB  - Major and trace element geochemistry of sediments is a very useful tool for understanding the provenance, intensity of weathering, tectonic settings, and depositional environment of the sediments. Sediments collected from different geomorphic domains (onshore and nearshore) of Rasulpur to Subarnarekha River mouths estuarine complex, East coast of India, were analyzed for their geochemical (major, trace contents) and mineralogical characteristics to determine their provenance, compositional maturity, paleo-weathering condition, and depositional environment. From geochemical studies, it is evident that the samples from the nearshore area suffered more weathering than the onshore samples. Geochemistry of the sediments suggests the protolith of the area to be of intermediate to felsic source rocks. A relative increase in the Al2O3/TiO2 ratio in sediments also suggests that they are derived mainly from intermediate to felsic source rocks. A strong positive correlation between Fe2O3, MnO, K2O, MgO, CaO, P2O5, and major oxides with respect to Al2O3 indicates that they are associated with micaceous/clay minerals. The Index of Compositional Variability (ICV) indicating low compositional and mineralogical maturity of the sediments. The Chemical Index of Alteration (CIA) value clearly pointing towards intense to intermediate weathering in the source area sediments. Similarly, Chemical Index of Weathering (CIW) results also supporting the same trend of weathering. The results of Plagioclase Index of Alteration (PIA) suggesting moderate destruction of feldspars during source weathering, transport, sedimentation, and diagenesis. The Ternary plot of A-CN-K and the binary plot of CIA/ICV also suggest that both geomorphological domains are immature in nature and suffered intense to moderate weathering. Trace-element concentrations in sediments result from the competing influence of provenance, weathering, diagenesis, and sediment sorting. The felsic province is also corroborated by elevated values of Ba, K, and Sr. EPMA analysis reveals the presence of heavy minerals comprising Ilmenite, garnet as major constituents followed by sphene and rutile. Other minerals include sphene, epidote, amphibole, pyroxene, biotite, apatite, chlorite, tourmaline, muscovite, and alumino-silicate. The concentration of TiO2 in Ilmenitedepicting a metamorphic signature with an igneous source. Micro-textural studies reveal different types of surface features of the grains, the various micro features have been produced by different transportational processes under different environmental conditions. Based on all geochemical and mineralogical data and different plots, it is evident that the sediments from both geomorphological domains are immature in nature and suffered intense to moderate weathering derived from mixed igneous and metamorphic sources.
VL  - 15
IS  - 1
ER  -
OPEC-I, Marine & Coastal Survey Division, Geological Survey of India, Kolkata, India
OPEC-IV, Marine & Coastal Survey Division, Geological Survey of India, Chennai, India
PSS, P&MN-1, CHQ, Geological Survey of India, Kolkata, India
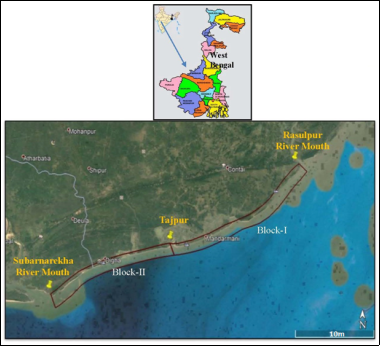
Figure 1. Location map of Study Area Rasulpur river mouth to Subarnarekha River Mouth, East coast India.
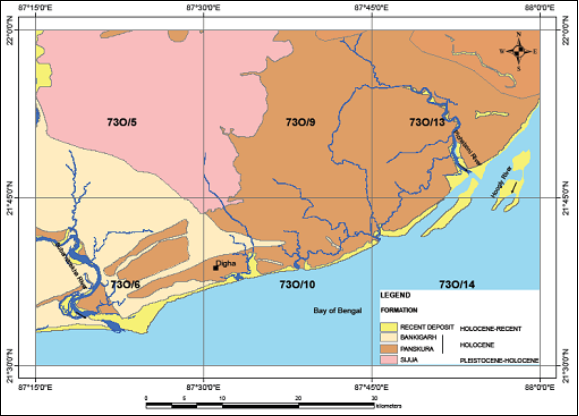
Figure 2. Geological Map of the Study Area Rasulpur river mouth to Subarnarekha River Mouth, East coast India.
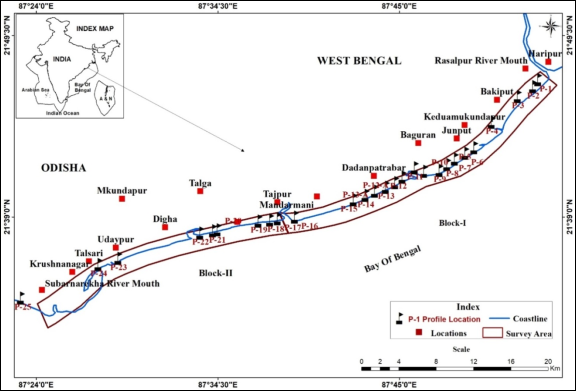
Figure 3. Onshore sample location map of Study Area (Rasulpur river mouth to Subarnarekha River Mouth, East coast India.
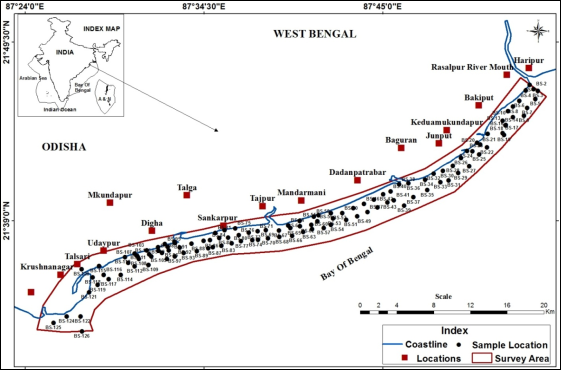
Figure 4. Near shore sample location map of Study Area (Rasulpur river mouth to Subarnarekha River Mouth, East coast India.
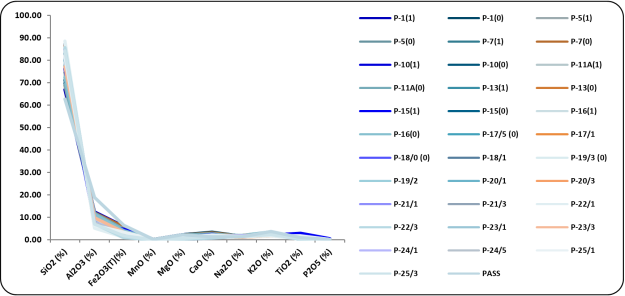
Figure 5. Concentration of Major oxides of surface sediments samples for (1) Onshore and (2) Near shore sediment from Rasulpur to Subarnarekha River Mouth.
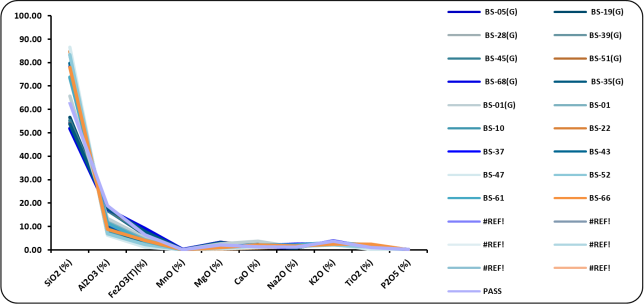
Figure 6. Concentration of Major oxides of surface sediments samples for (1) Onshore and (2) Near shore sediment from Rasulpur to Subarnarekha River Mouth.
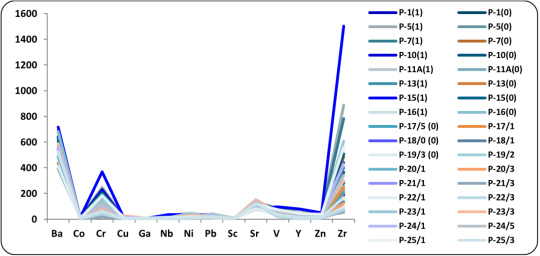
Figure 7. Concentration of Trace Elements of surface sediments samples for (3) Onshore and (4) Near shore sediment from Rasalpur to Subarnarekha River Mouth.
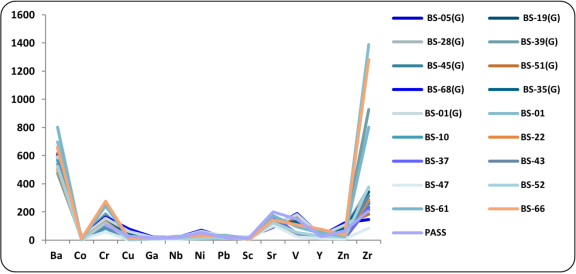
Figure 8. Concentration of Trace Elements of surface sediments samples for (3) Onshore and (4) Near shore sediment from Rasalpur to Subarnarekha River Mouth.
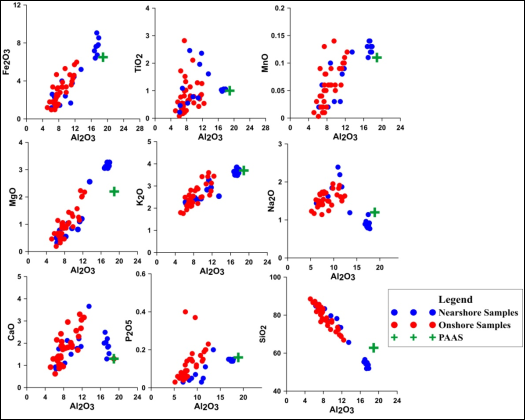
Figure 9. Major Element vs Al2O3 bivariant plot showing distribution for Onshore and Near shore sediment from Rasulpur to Subarnarekha River Mouth.
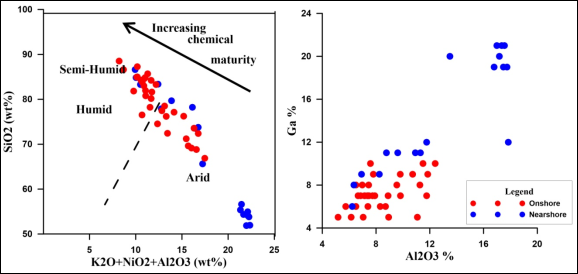
Figure 10. Plot of SiO. 2 (reflective of quartz content) versus K2O+Na2O+Al2O3 (reflective of feldspar content), ii. Gavs Al2O3 bivariant plot showing distribution for Onshoreand Near shore sediment from Rasulpur to Subarnarekha River Mouth..
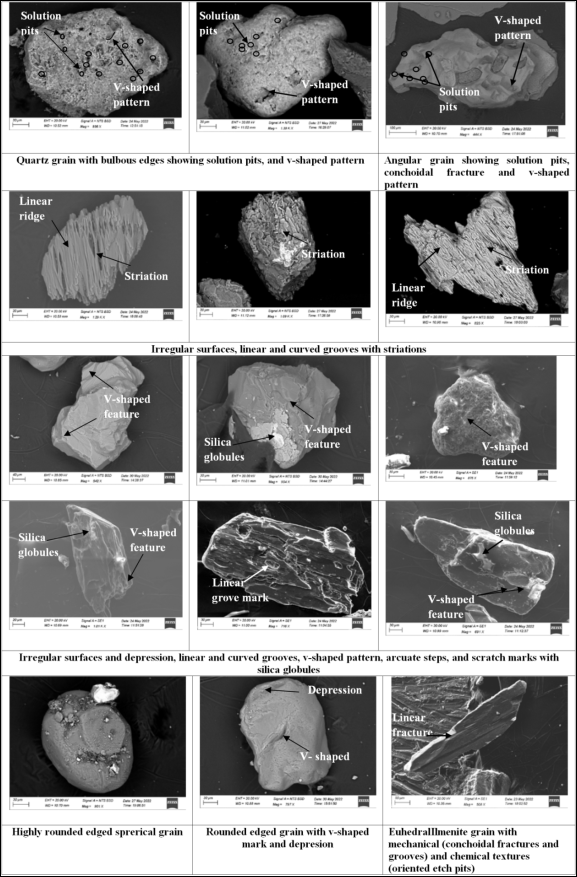
Figure 11. Morphology, surface features and micro textures of grains from SEM-EDX images of the study area.
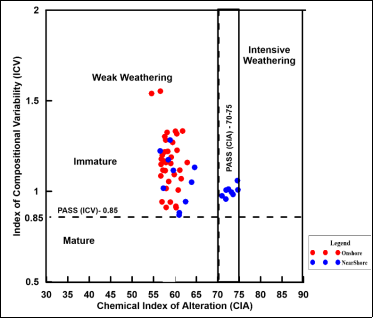
Figure 12. ICV-CIA plot (after Long et al., 2012b) for Onshore and Near shore sediment from Rasulpur to Subarnarekha River Mouth.
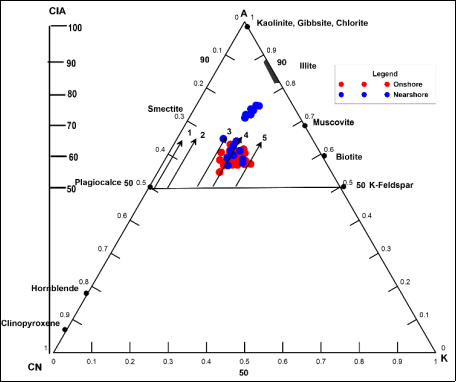
Figure 13. A-CN-K (Al2O3-CaO*+ Na2O-K2O) Ternary Diagram (Nesbitt and Young, 1984) for Onshore and Near shore sediment from Rasulpur to Subarnarekha River Mouth are also shown. (Numbers 1-5 denote trends of initial weathering profiles of various rock types: 1. Gabbro; 2. Tonalite: 3. Diorite; 4. Granodiorite; 5. Granite).